
 Neven Zitek
 So far, we’ve established the purpose of the ITIL CSI 7-step improvement process (you can catch up by reading the following article if you haven’t already: ITIL CSI 7-step improvement process: What is it all about?), and we’ve made all necessary preparations along with data gathering as described in ITIL CSI 7-step improvement process: Start gathering the data.
Now it’s time to continue our activities by processing, analyzing, and presenting findings, before the actual implementation of corrective actions.
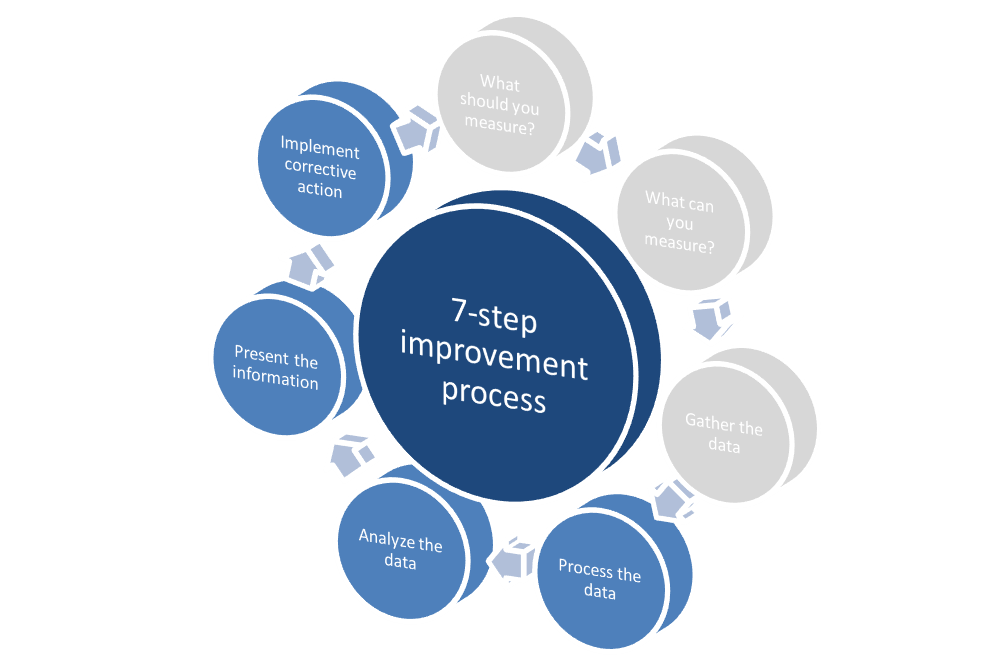
Figure 1 – ITIL CSI 7-step improvement process (steps marked blue are covered within this article)
Step 4: Process the data
At this point, our data-gathering mechanisms should be in place and generating the required data. But, before we jump into an analysis of the data gathered, it’s highly recommended to process the data first. As mentioned in the previous article, data can be gathered from various sources: reporting services, monitoring tools, Service Management System (SMS), external reports (already formatted in a presentable format), etc.
Before data can be used for quality analysis, it should be normalized and processed by grouping it into logical sets. This can be performed by using spreadsheets or similar tools, but the output should be aligned with the requirements set by the following step: data analysis.
Step 5: Analyze the data
The most interesting and the most challenging part of any CSI initiative is, by far, data analysis. If you spot a trend in the number of reported incidents, is it a good thing or a bad thing? Is this trend the result of problem management initiatives, or are customers simply bypassing your support because they feel like it’s not useful, or worth the trouble? I witnessed this situation when a company switched its IT operating model from Type I (Internal Service Provider) to Type II (Shared Service Provider). End users found the new centralized support procedures to be too much of a hassle, so they simply stopped contacting the proper channels, and turned to anyone who could assist them…
Data analysis requires a lot of experience and in-depth awareness of what is actually going on within and outside the IT organization. For example, it’s one thing knowing that a targeted service’s uptime was 99.999%, but quite another that no one could actually access it. And, while data analysis is perfect to spot ongoing trends, true value lies within understanding the root cause.
The purpose of this step can be summarized in the following questions:
- Are IT operations running as planned? Look for deviations.
- Are SLA targets being met? Look for breaches.
- Are there any underlying structural problems? Look for overhead.
- Are there any trends? If so, what is causing them? Can they be identified as positive or negative? Look for patterns.
- Are there any corrective actions required? Look for imperfections.
Step 6: Present the information
While it may look straightforward, presenting the information is such a complex activity that countless books have been written on the subject. Even if you performed the previous six steps perfectly, it can all be in vain if the presentation is performed poorly, diminishing all effort.
There are some general guidelines for the presentation, and they all revolve around common sense: know your target audience; articulate the purpose (what you are trying to achieve); if there is a goal, make sure that data contained is relevant to it; and, if possible – tell the story.
Here are some examples that may help: we often present availability in percentages (99.95%, or 99.999%), but most people can’t perceive the meaning (business management in particular); therefore, try to put it in perspective – we’ve achieved 99.95% annual availability, and with only three minor outages lasting just over an hour each, we are well above the 99.8% target. If your format can handle it, it’s highly effective to squeeze in a comparison of some sort as well. We often use the last year, or last three years, but you can use your competitors, or even projections that were made earlier. And don’t forget the executive summary!
Step 7: Implement corrective action
Corrective actions should be organized into logical groups, sorted by impact (on current operating model), gap (deviation from mission, vision, and set goals), investment required, complexity, and legal or other compliance driver. In most cases, organizations can’t afford to implement all corrective actions at once, or some may become obsolete if strategy changes. Therefore, we should provide means, as described, for the organization to prioritize implementation of corrective actions based on its own perception of gained value.
CSI as the best practice
While IT organizations struggle with the “value concept,” even those who made a business out of it, they still somehow operate around the CSI more than within it. This can be observed best by looking at when and how corrective actions are implemented.
Corrective action is often implemented in reaction to a single event that caused a major outage to part or all of the organization. Other times, the smaller imperfections will be noticed and specific corrective action will be implemented in no relation to the priorities of the organization, thus taking valuable resources away from real emergencies. This is a common practice, but obviously not the best practice.
CSI is interfaced with all other processes in the scope of the service lifecycle. Use this free Checklist of recommended ITIL documents for processes and functions to see which documents are produced throughout the lifecycle, and you can use them for improvement initiatives.