
 Strahinja Stojanovic
 In clause 9.1.1.1, IATF 16949 requires organizations to determine the appropriate use of statistical tools, and Statistical Process Control (SPC) is the usual choice. SPC is a methodology mainly used to monitor and control the behavior of the manufacturing process, but it can be used for any process that has measurable outputs. Its main purpose is to ensure continuous improvement in the quality of products and services and productivity in the workforce.
SPC was developed by Walter Shewhart in the early 1920s for Bell Laboratories, but the wide application of the methodology started during World War II in the military industry. The demand for product had forced the U.S. military to look for a better and more efficient way to monitor product quality without compromising safety, and SPC filled that need.
After the war, the application of the methodology declined until it was rediscovered in 1970 by Japanese manufacturing companies, and later returned in the U.S. as American companies began to feel pressure due to high-quality products being imported from Japan. Today, SPC is a widely used quality tool throughout many industries.
What is SPC, and why use it?
Statistical Process Control, part of IATF 16949 core tools, is an analytical decision-making tool that allows the organization to determine whether the process is performing correctly or not. SPC is a method of measuring and controlling quality by monitoring the manufacturing process. Quality-related data is obtained in the form of product or process measurements, or readings from various machines or measuring devices.
The data is collected and used to evaluate, monitor, and control a process. The aim of the process monitoring and control is to ensure that it operates at its fullest potential. One of the most comprehensive and valuable resources for information regarding SPC is the manual published by the Automotive Industry Action Group (AIAG).
In the world of ever-increasing competition and raw material prices, organizations must concentrate on their processes in order to increase efficiency and reduce costs. Relying only on the inspection of products after production to detect quality issues is not enough for many companies. The aim of implementing SPC is to move the company from detection after production to prevention. Application of SPC enables an operator to detect trends and changes in the manufacturing process before they lead to defective product or scrap.
Control charts
The most successful and widely used SPC tools are control charts. Control charts show the variation in a measurement during the time period that the process is observed. Process control charts are fairly simple-looking, connected-point charts. The points are plotted on an x/y axis, with the x-axis usually representing time. The plotted points are usually averages of subgroups or ranges of variation between subgroups, and they can also be individual measurements.
Some additional horizontal lines representing the average measurement and control limits are drawn across the chart. Notes about the data points and any limit violations can also be displayed on the chart.
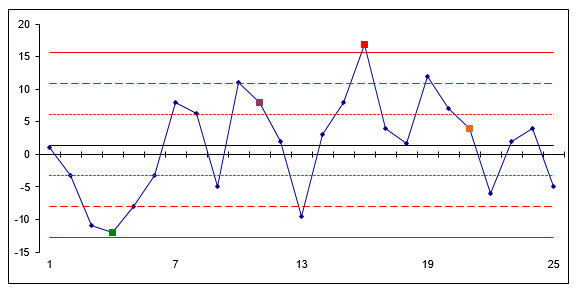 Figure: Example of Control Chart
Control charts are an essential tool of continuous quality control. Control charts monitor processes to show how the process is performing, and how the process and capabilities are affected by changes to the process. This information is then used to make quality improvements.
Control charts are also used to determine the capability of the process. They can help identify special or assignable causes for factors that impede peak performance.
Control charts show whether a process is in control or out of control. They show the variance of the output of a process over time, such as a measurement of width, length, or temperature. Control charts compare this variance against upper and lower limits to see if it fits within the expected, specific, predictable, and normal variation levels.
If so, the process is considered to be in control, and the variance between measurements is considered normal random variation that is inherent in the process. If, however, the variance falls outside the limits, or has a run of non-natural points, the process is considered to be out of control.
There are a handful of control charts that are commonly used. They vary slightly depending on their data, but all have the same general fundamentals: data points plotted on an x/y axis, where x represents time, along with an average or center line and upper and lower control limits.
The data points recorded on a control chart should fall between the control limits, provided that only common causes and no special causes have been identified. Common causes will fall between the control limits, whereas special causes are generally outliers or are outside of the control limits. For a process to be deemed as being in statistical control, there should be no special causes in any of the charts. A process in control will have no special causes identified in it, and the data should fall between the control limits.
Great tool that anyone can use
The benefits of SPC and control charts are self-evident, and even if the organization is not planning to implement IATF 16949, those benefits can be harvested. An advantage of SPC over other methods of quality control, such as “inspection,” is that SPC emphasizes early detection and prevention of problems, rather than the correction of problems after they have occurred.
In addition to reducing waste, SPC can lead to a reduction in the time required to produce the product. SPC makes it less likely the finished product will need to be reworked or scrapped.
To implement IATF 16949 easily and efficiently, use our IATF 16949 Documentation Toolkit that provides step-by-step guidance and all documents for full IATF 16949 compliance.